Exploring Case Law
Overview
In early 2021, spurred on by many discussions with my incredible, law-student (among many other fantastic characteristics) girlfriend, I decided to try my hand at analyzing Canada’s legal system. Absolutely everything I know about the law I’ve learned from TV shows and a year’s worth of hanging out with law students — which is to say, I don’t know anything.
Oh yeah, and also I don’t know anything about data science or visualization. I’m a computer scientist by trade, and can navigate my way around complicated mathematics better than your average Joe. This projected seemed like a good opportunity to teach myself some of the more obscure bits of graph theory, interactive web design (most of the charts on this page are interactive,) data scraping and subsequent mining.
Often, outsiders can bring new ideas and techniques to otherwise insular communities. Despite knowing nothing, I managed to:
- determine the speed at which our court of appeal system works
- find that somewhere between 33% and 50% of all cases are completely trivial and could be easily automated away
- reliably find decisions that are important enough to have Wikipedia articles
- find the asymptotics of the growth rate of Canadian case law
- determine that BC and Alberta are by far the most powerful provinces with respect to the influence of their decisions, and,
- separate decisions automatically into 860 different “areas of law”
These are not half-bad results, if I do say so myself. And if one guy who doesn’t really know how to use this technology can do this well, imagine how much damage someone with high-quality data, a budget, and knowledge could do. If you are in the legal field and aren’t yet positioning yourself for the upcoming automation wave, maybe this essay will help convince you that the system isn’t nearly as robust to automation as you might think. I did all of this in two weeks, as an outsider, with no domain knowledge. That should scare you.
Overall, I needed to collect and analyze all of the data myself. I spent maybe fifteen hours programming things, and roughly 336 hours collecting data. I fought with analytics tools for another ten hours, and this write-up took maybe twenty hours. It was a fun project, but I’m happy to be done with it.
Methodology
My assumption is that the citation graph of Canadian case law is sufficient to find interesting data in the law. Unfortunately, this data doesn’t seem to exist in any convenient format. CanLII makes the data available on the web, but doesn’t provide any sort of downloadable database. So I needed to make my own.
I wired up a small web-scraper that would connect to CanLII and crawl through the millions of cases available there. My program loaded all the cases from the Supreme Court and provincial courts of appeal, then followed every cited case. And every case cited by every one of those. And so on and so forth, until there were no more cited cases I hadn’t yet downloaded.
After a few weeks of downloading, I was finished. In total, I downloaded 378,732 decisions from 269 different courts. Between these cases, there are 1,998,118 citations. Frighteningly, this is nowhere near the extent of Canadian case law; it’s maybe one tenth of the full corpus. But I feel comfortable in saying that this subset is the law as it exists today. If a case doesn’t lie anywhere in the transitive dependencies of the Supreme Court or a court of appeals, it’s not contentious for anyone to care about.
Despite the large number of cases, it’s important to discuss just how little data I’ve got per case. The totality of my data about cases is of this form:
| name | year | language | jurisdiction | court |
|---|---|---|---|---|
| Bamba c. R. | 2019 | fr | qc | qcca |
| R. v. Leach | 2019 | en | bc | bcca |
| R. v. Pruski | 2006 | en | on | oncj |
| Regina v. Imperial Optical Co. Ltd. | 1972 | en | on | oncj |
| Windheim c. Windheim | 2012 | en | qc | qcca |
Notice that there is no information about the contents of these cases. I don’t know which judge was presiding, what was said, what the case was about, keywords, or even who won.
In principle I could have extracted the involved parties by trying to tear apart the name, but it seemed challenging to do well, and I don’t think it would buy me much information without knowing who won.
On the citation front, all I know is this:
| citing_case | citing_year | cited_case | cited_year |
|---|---|---|---|
| The King v. Clark | 1901 | Automobile and Supply Co. v. Hands, Ltd. | 1913 |
| The King v. Clark | 1901 | The Queen v. Hammond | 1898 |
| The King v. Clark | 1901 | The Queen v. Harris | 1898 |
| Gallagher v. Hogg | 1993 | Katz v. Katz | 1990 |
| Gallagher v. Hogg | 1993 | Lagimodiere v. Lagimodiere | 1991 |
Again, no actual information here.
To reiterate, there’s nothing at all that we can use to learn what any particular case was about. In this database, the vanishing majority of the information available to us is which cases cite whom. Anything we want to figure out needs to be inferred from that.
Possible Issues
The Canadian legal system has existed much longer than the idea that information should be freely available. While CanLII is an excellent source of data, it explicitly states how complete its records are from each court. For example, while CanLII has the entire corpus of Supreme Court decisions, it’s only maintained continuous coverage of the BC Court of Appeal (BCCA) since 1990. Other courts have different starting dates for their continuous coverage.
This presents a systematic bias in our data, namely that more recent cases are more readily available. To illustrate, the database contains 6,212 cases from the BCCA before 1990, but 19,368 cases since. While we might be interested in whether the volume of law is increasing over time, we must be careful to restrict ourselves to the range of continuous coverage.
Looking only at citation data introduces another systematic bias in the dataset: older cases have had a longer time to accumulate citations. Because we mainly keep track of relationships between cases, it’s possible for recent cases to contradict previous decisions. Such a case is clearly very important to the law, but will fly under our radar until it becomes commonly cited.
Verifying the Dataset
Before getting started, let’s make sure our data is sane. For example, since case law is immutable, it’s impossible for a case to cite a decision in the future. Therefore we should never see any time-traveling citations in our dataset.
But in fact, there are 1197 cases on CanLII which cite decisions in the future! For example, Molson v. Molson, 1998 cites C.T.G. v R.R.G., 2016. Clicking through the first link here shows that what is labeled as “Molson v. Molson, 1998” is actually “Richardson v. Richardson, 2019.”
A few other oddities show up, some of which are trial level courts citing their appeal. These seem more reasonable, and I read this as whoever was doing data entry was typing in the wrong field.
This erroneous data makes up only 0.31% of our dataset, so it doesn’t seem like fixing it is worth the effort.
Average Age of Citation
How long do decisions stay relevant for? By looking at the average age at which a decision is cited, we can get a feel.
select avg_age, count(*) from (select cast (avg(src_year - dst_year) as int) as avg_age from expanded_citations where src_year >= dst_year group by dst_hash) group by avg_age;
It looks like cases stay relevant for about 11 years, at which point the inflection point of this graph switches, and we see the long tail. This is for the law in aggregate, but what about if we look at the average age when cited, broken down by court?
select dst_court, cast (avg(src_year - dst_year) as int) as avg_age from expanded_citations where src_year >= dst_year and dst_court in (select court from important_courts order by max desc limit 15) group by dst_court;
This chart shows the top 15 most important courts. Among them, the really big, important courts hold sway longer than the smaller courts. But is the story different for the smallest courts?
select dst_court, cast (avg(src_year - dst_year) as int) as avg_age from expanded_citations where src_year >= dst_year and dst_court in (select court from important_courts order by max asc limit 10) group by dst_court;
Definitely a different story here. These smaller courts’ decisions fall off in relevance significantly faster than their larger counterparts.
A corollary to this question of law relevance is to look not at the citee, but the citing case. What is the average age of a case’s citations?
select avg_age, count(*) from (select cast (avg(src_year - dst_year) as int) as avg_age from expanded_citations where src_year >= dst_year group by src_hash) group by avg_age;
The fall-off here is closer to 20 years — compared to the ten year average lifespan of a decision. The discrepancy between these numbers suggests that cases are likely to a few old cases and numerous newer ones. Maybe cases will cite an original precedent, and then many other cases that have followed the precedent?
When looking at average age of citation, we can look for trends over time. How has the average age of citation changed over the years?
select src_year, avg(avg_age) as avg_age from (select src_year, avg(src_year - dst_year) as avg_age from expanded_citations where src_year >= dst_year group by src_hash) group by src_year;
And again, let’s compare these average ages by big courts:
select src_court, cast (avg(src_year - dst_year) as int) as avg_age from expanded_citations where src_year >= dst_year and src_court in (select court from important_courts order by max desc limit 15) group by src_court;
Wow! Look at the big courts. There is almost no variance in the average age of citations — they’re all clustered right around 13. Seeing as these are all of the appeal-level courts, it strongly suggests that this is the speed of our legal system. It takes thirteen years on average to make it through the entire appeal process. Disgustingly slow.
There’s nothing interesting in the small courts graph — they show the same variances as in the duration of case relevance.
Complexity of the Law
Although there are nearly 400,000 cases in our dataset, I don’t think most of those can possibly be interesting. My understanding of case law is that usually a precedent has already been set, and the judge almost always defers to that precedent. To find cases like these, we can look at the number of decisions cited by a case. If a case cites only a few decisions (let’s say three or fewer,) it’s probably just agreeing with precedent.
select c, count() as count from (select count() as c from expanded_citations where src_year >= (select year from coverage where court = src_court) group by src_hash) group by c; BUCKETED BY HAND
The number of cases cited falls off exponentially as we’d expect, so I bucketed the higher number of citations in this chart. But take a look: roughly one third of all cases cite three or fewer decisions, and nearly a sixth cite only one!
If our hypothesis is true, it means that one sixth of all cases are glaringly obvious wastes of time, and a third are trivially decided. But does this hold true across all courts? Let’s look at the breakdown for a few of the highest importance courts:
select c, count() as count from (select count() as c from expanded_citations where src_year >= (select year from coverage where court = src_court) and src_year >= 1950 and src_court = ‘scc’ group by src_hash) group by c;
I filtered the SCC decisions to only look at cases after 1950 — earlier ones were too likely to not have their citations available on CanLII, and would thus throw off our analysis. But amazingly, even of cases that make it to the Supreme Court, still more than a third of them cite only three or fewer decisions.
That sounds a little crazy to me, so I went on CanLII and randomly clicked on a few supreme court cases. And sure enough, many of them do only cite one case! Inspecting them visually, these cases come with extraordinarily short documents — many are under 1000 words.
Let’s see if this holds for the AB, BC, ON and QC courts of appeal as well:
select c, count() as count from (select count() as c from expanded_citations where src_year >= (select year from coverage where court = src_court) and src_court = ‘abca’ group by src_hash) group by c;
select c, count() as count from (select count() as c from expanded_citations where src_year >= (select year from coverage where court = src_court) and src_court = ‘bcca’ group by src_hash) group by c;
select c, count() as count from (select count() as c from expanded_citations where src_year >= (select year from coverage where court = src_court) and src_court = ‘onca’ group by src_hash) group by c;
select c, count() as count from (select count() as c from expanded_citations where src_year >= (select year from coverage where court = src_court) and src_court = ‘qcca’ group by src_hash) group by c;
Pretty close to half of the cases that come through these appeal-level courts are trivial. If we could automate decisions of this sort, we should be able to make the appeal system roughly 70% faster — reducing the average time per case from 13 years to 7.5. I can’t find any numbers on how expensive the court system is to run, but this would reduce its cost by 70% as well, which is almost certainly something worth investigating.
Volume of Law
What’s the rate of law being accumulated? Is it accelerating? We can look at the number of cases per year per court over the last 30 years1 to get a sense of the acceleration of accumulation:
select court, year, count(*) as count from decisions d where court in (select court from important_courts order by max desc limit 10) and year >= 1990 and year >= (select year from coverage c where d.court = c.court) and 2021 > year group by court, year;
Those lines all look pretty constant to me, which makes sense if you assume the courts are limited by time and that they have no gains in efficiency (lol.) So no, the volume at which law is accumulating in Canada is not accelerating. But remember that this graph is the velocity of change, which means the volume of law is growing linearly with respect to time.
select y.year, count(*) as volume from (select distinct year from decisions order by year) y inner join decisions d on y.year >= d.year where 2021 > y.year group by y.year;
No, wait, that does look exponential. I forgot. While the volume per court is staying constant, the number of courts grows with year:
select y.year, count(*) as volume from (select distinct year from decisions order by year) y inner join (select min(year) as year from decisions group by court) c on y.year >= c.year where 2021 > y.year group by y.year;
This graph estimates the number of courts in existence by the first decision we have from that court being the year it was created — which seems like a satisfactory proxy. The curve appears to have leveled off, but I think this is due to 2020 being a GLOBAL PANDEMIC. If I had to guess, I’d say the inflection point around 1997 is an artifact of the digitization of law, and that this curve will continue linearly.
Who Cites Whom?
Are certain provinces “friends?” Which provinces influence which others? Let’s look at the percentage by which one provinces’ courts cite another provinces:
with data as (select src_jurisdiction, dst_jurisdiction, count() as count from expanded_citations where src_jurisdiction != dst_jurisdiction group by src_jurisdiction, dst_jurisdiction), totals as (select src_jurisdiction, sum(count) as total from data group by src_jurisdiction) select d.src_jurisdiction, d.dst_jurisdiction, d.count 100.0 / t.total as count from data d inner join totals t on d.src_jurisdiction = t.src_jurisdiction;
Yow! The fed is understandably white hot, and dominates this chart. Let’s remove it to look more closely at the provinces:
with data as (select src_jurisdiction, dst_jurisdiction, count() as count from expanded_citations where src_jurisdiction != dst_jurisdiction and src_jurisdiction != ‘ca’ and dst_jurisdiction != ‘ca’ group by src_jurisdiction, dst_jurisdiction), totals as (select src_jurisdiction, sum(count) as total from data group by src_jurisdiction) select d.src_jurisdiction, d.dst_jurisdiction, d.count 100.0 / t.total as count from data d inner join totals t on d.src_jurisdiction = t.src_jurisdiction;
Now Ontario dominates, followed closely by BC and Alberta. Nobody cites the territories — but also, nobody cites Quebec. No wonder they feel discriminated against.
Let’s look at the same chart, but this time split by big courts rather than provinces.
with courts as (select court from important_courts order by max desc limit 13), data as (select src_court, dst_court, count() as count from expanded_citations where src_court != dst_court and src_court in courts and dst_court in courts group by src_court, dst_court), totals as (select src_court, sum(count) as total from data group by src_court) select d.src_court, d.dst_court, d.count 100.0 / t.total as count from data d inner join totals t on d.src_court = t.src_court;
There’s an interesting feature of this graph, namely the “friendship pairs” that lie along the diagonal. For example, bcsc cites bcca much more than it cites anything but the scc — and vice versa! Thinking about it, I guess this makes sense, and is mainly showing us the hierarchical nature of such courts. Of course bcsc cites bcca more than chance, since it must defer. And vice versa also makes sense, because a case must go through bcsc in order to get to bcca.
Well, not every stream you pan will have gold.
Determining Important Cases
The sheer size of the case law corpus is staggering. My dataset contains roughly 400,000 decisions — a small fraction of the actual law. And this is a few orders of magnitude larger than any human could possibly remember.
Thankfully, most of this data is noise. Most cases taken to court are decided uninterestingly: the presiding judge simply defers to precedent and everyone goes on their way. It’s safe to say that decisions of this sort are unimportant. In my opinion, the desired end-state of the law is for all cases to be decided like this — at that point, we’ve got a stable, entirely-predictable system.
But that is not (yet!) the world we live in. Some cases are interesting — for example, the ones which set precedent, and the ones which contradict precedent. How can we find these cases?
Humans would probably look at the cases, and think about first principles, and talk to other people they think are smart, and think really hard, and maybe go consult some textbooks, in an attempt to determine which cases are important. The computer is too dumb to do any of that. It’s only good at moving numbers around ridiculous fast, and I’m very good at turning problems that don’t sound like they involve numbers into ones that do.
So how can we introduce numbers into this problem?
Rather than trying to compute importance directly, let’s instead try to approximate it. Intuitively, cases which are important will be cited more often than cases which are not important. Thus, citation count is — to a first approximation — a good model for importance. Indeed, this seems to be how most law software computes importance.
To improve our model, let’s take an intellectual detour and think about the importance of websites. Imagine the website for Reputable News Network (RNN). By virtue of being a reputable news site, it will naturally be linked to quite often. Like in the case law example, this should improve our estimate of RNN being an important site.
But now consider the sites that RNN links to. Maybe RNN is running a story on bloggers, and links to Paul Podunk’s Personal Page (PPPP). PPPP is news-worthy by definition due to being on RNN, and surely news-worthy things are more important than non-influential things. Thus, PPPP should be considered more important, sheerly by virtue of having been linked-to by an important thing.
Of course, this new influence that PPPP has acquired from RNN should also be accounted for — sites that PPPP links to become more important due to their relevance to PPPP. And so on, and so forth. But critically, these sites are considered less important than they would be if RNN linked to them directly, since RNN is significantly more influential than PPPP.
The key assumption of this model is that important things run in the same circles as other important things. This jives with my intuition. It’s clearly true in the news cycle. It’s why people name drop in order to raise their social standing — if they know important people, they must too be important. Of course, this is not a perfect model for importance, but it gets the broad strokes.
And, if you have any remaining doubts, this exact algorithm is what powers Google search. Clearly, Google (an important entity) wouldn’t be using this technique if it didn’t work. Therefore it probably does work. See? This technique works everywhere.
Returning to law, let’s replace “websites” with “decisions,” and “links” with “citations.” We can compute the importance of cases by seeing which important cases they’re connected to.
Verifying Important Cases
After crunching the numbers for a few hours, I came up with an importance score for each case. It’s hard to get a real intuition for what these scores are, but a safe interpretation is that a higher importance score corresponds to a more-important case.
To verify that these importance scores actually correspond with reality, I took the names and years of the top 50 cases, and searched for a Wikipedia page on the topic. My theory is that really important cases will be important enough to have Wikipedia commentary about them for laypeople like me.
At time of writing, of the top 50 cases, 34 have Wikipedia articles. And among those, 22 are described in the first sentence as either a “landmark” or a “leading” case.2 That’s a pretty good sign.
Without further ado, here are the 50 most important cases by my analysis:
- Dunsmuir v. New Brunswick
- Canada (Citizenship and Immigration) v. Khosa
- Baker v. Canada (Minister of Citizenship and Immigration)
- Newfoundland and Labrador Nurses’ Union v. Newfoundland and Labrador (Treasury Board)
- Housen v. Nikolaisen, 2002
- Hunter et al. v. Southam Inc.
- R. v. Collins
- R. v. Oakes
- Alberta (Information and Privacy Commissioner) v. Alberta Teachers’ Association, 2011
- Pushpanathan v. Canada (Minister of Citizenship and Immigration)
- Rizzo & Rizzo Shoes Ltd. (Re)
- Dr. Q. v. College of Physicians and Surgeons of British Columbia
- Canada (Director of Investigation and Research) v. Southam Inc.
- Law Society of New Brunswick v. Ryan
- R. v. Big M Drug Mart Ltd.
- R. v. Grant
- Re B.C. Motor Vehicle Act
- Agraira v. Canada (Public Safety and Emergency Preparedness), 2013
- C.U.P.E. v. Ontario (Minister of Labour)
- Suresh v. Canada (Minister of Citizenship and Immigration)
- R. v. Stillman
- R. v. M. (C.A.), 1996
- R. v. O’Connor
- Toronto (City) v. C.U.P.E., Local 79, 2003
- Andrews v. Law Society of British Columbia
- Irwin Toy Ltd. v. Quebec (Attorney General)
- Canada (Attorney General) v. Mossop
- Bell ExpressVu Limited Partnership v. Rex, 2002
- Canada (Minister of Citizenship and Immigration) v. Vavilov
- C.U.P.E. v. N.B. Liquor Corporation
- R. v. Edwards Books and Art Ltd.
- R. v. Lyons, 1987
- McLean v. British Columbia (Securities Commission), 2013
- U.E.S., Local 298 v. Bibeault
- Canada (Canadian Human Rights Commission) v. Canada (Attorney General), 2011
- R. v. Garofoli, 1990
- Blencoe v. British Columbia (Human Rights Commission)
- R. v. Therens
- Smith v. Alliance Pipeline Ltd., 2011
- R. v. W.(D.)
- RJR-MacDonald Inc. v. Canada (Attorney General)
- Sketchley v. Canada (Attorney General), 2005
- R. v. Mann
- Cepeda-Gutierrez v. Canada (Minister of Citizenship and Immigration), 1998
- Slaight Communications Inc. v. Davidson
- Committee for Justice and Liberty et al. v. National Energy Board et al., 1976
- R. v. Debot, 1989
- Mission Institution v. Khela, 2014
- R. v. Morgentaler
- R. v. Sharpe
If you’re a law professional, you might disagree with this list. Maybe the ordering is wrong. Maybe there are some glaring omissions, or some strange choices. Glaring omissions are probably caused by recency bias — new important decisions simply haven’t had time to accumulate citations (and thus importance.) The wrong ordering? That’s just like, your opinion, man.
But of particular interest to me are the cases on this list that aren’t on Wikipedia. Assuming Wikipedia is a reasonable proxy for what lawyers think are important cases, the missing articles here have previously-unacknowledged importance.
Anyway, it seems like my calculated importance score correlates pretty well with real-world importance. But let’s try to falsify that hypothesis, and see if the bottom-ranked cases have Wikipedia articles.
I checked. They don’t. Not a single hit in the 50 I tried3. I also checked for Wikipedia articles on a randomly-selected set of 50 cases, in an attempt to find the base-rate we should expect to see. Again, there wasn’t a single hit.
These negative results add strong evidence that my importance score is measuring something real. Remember, there is absolutely no human judgment going into this analysis; my program is simply crunching the numbers based on who cites whom. The fact that it can identify any important cases whatsoever is jaw-dropping.
Statistical Biases
So we’ve successfully found important cases. My first question is, how necessary was all of this fancy math? Could I just have ignored it and gone straight to number of citations? How correlated is the importance metric with the raw number of citations? Let’s see:
select dst_importance, count(*) as count from expanded_citations group by dst_hash order by dst_importance desc limit 1000 offset 1;
If the two metrics were strongly correlated, we should see a nice sharp diagonal line going up and to the right. We don’t. Instead we see, well, I’ll leave the Rorschach test up to you. There’s clearly some correlation, but it’s not particularly strong. So no — we can’t just use the citation count!
Another thing you might be wondering is, “what courts do all these important cases come from?” Good question:
select court, count(*) as count from (select court from decisions order by importance desc limit 1000) x group by court having count > 20; THEN OTHER = 1000 -
Interesting. The Supreme Court takes most of the cake, but Ontario and Quebec are crowded out by BC and Alberta. Drilling down into the “other” category from the chart above:
select court, count(*) as count from (select court from decisions order by importance desc limit 1000) x group by court having count <= 20 and count > 5;
It surprising to me that Ontario and Quebec are so underrepresented in their number of important cases, compared to their populations and age. I don’t know what’s going on here — please let me know if you do, gentle reader.
The other big question I have is to what degree this importance factor is biased by the courts’ continuous coverage. That is to say, of the most important cases identified, how many of them are from before CanLII started continuous coverage?
Only 13 of the top 1000 (1.3%) cases are from before the year of continuous coverage. This doesn’t jive with my intuition — presumably the cases which are on CanLII before the date of continuous coverage are the most important ones. They’re the cases that someone went in and added manually, before the system was set up to track this stuff automatically.
OK, so the importance metric is clearly biased against old cases. But is it also biased against new cases? Let’s look at the number of top important cases by year:
select year, count(*) as count from decisions where hash in (select hash from decisions order by importance desc limit 1000) group by year;
Rather surprisingly, it doesn’t seem to be. I’d expect newer cases to not have had time to accumulate citations, and to thus be biased-against in the importance metric. So what’s going on here? It’s that I slightly lied to you earlier; that our importance metric doesn’t take into account the direction of the citation. In essence, it means that you get the same amount of influence for citing important cases as you would for important cases citing you. This is often a better approach than the directed version for datasets in which there are no loops. In the absence of loops (where X cites Y which cites Z which cites X again,) all of the influence gets pooled at the very oldest cases, and in effect tracks progeny.
Switching to this directed importance metric will likely show the bias against recency that we’d expect to see. So let’s look at that same chart as before, except using the directed importance metric instead:
select year, count(*) as count from decisions where hash in (select hash from decisions order by dimportance desc limit 1000) group by year;
This metric nicely prioritizes old cases, like our previous metric emphasized newer cases. In fact, the directed importance score puts 865 of the its top 1000 (86.5%) cases before the date of continuous coverage.
We’d be very happy if we could somehow mix the two metrics together to get an importance score that has no time-bias. Unfortunately, it’s unclear to me how to combine the two together; we probably can’t meaningfully add eigenvalues — but let’s try it anyway.
select year, count(*) as count from decisions where hash in (select hash from decisions order by importance + dimportance desc limit 1000) group by year;
I don’t know if this is meaningful. It seems unlikely that there was a period of 40 years from 1940 to 1980 in which no important decisions were made — but then I realized this corresponds pretty closely when with Canada became a Commonwealth nation (1931) and when it became sovereign (1982). To quote the first link on Google I found:
In 1931, England put Canada on equal footing with other Commonwealth countries through the Statute of Westminster, which essentially gave its dominions full legal freedom and equal standing with England and one another. However, Britain still had the ability to amend the Canadian constitution, and Canada took time to cut its legal ties to England. Meanwhile, it adopted its own national symbols, like the Canadian flag, featuring the maple leaf, which debuted in 1965.
It took five decades after the Statute of Westminster for Canada to make its final step toward full sovereignty. In 1982, it adopted its own constitution and became a completely independent country.
Emphasis mine. Maybe this “taking its time” stuff was just Canada coasting? Hopefully the law and/or history people can get in touch and let me know if this graph of mine is at all meaningful. This is flaw in the data-driven approach — your analysis can only be as good as your data is. We’re always going to need subject matter experts.
Discovering Neighborhoods
Imagine I give you a map of the world’s road network, with all of the topological features like water and altitude removed, as well as all landmarks and zoning information. For example:
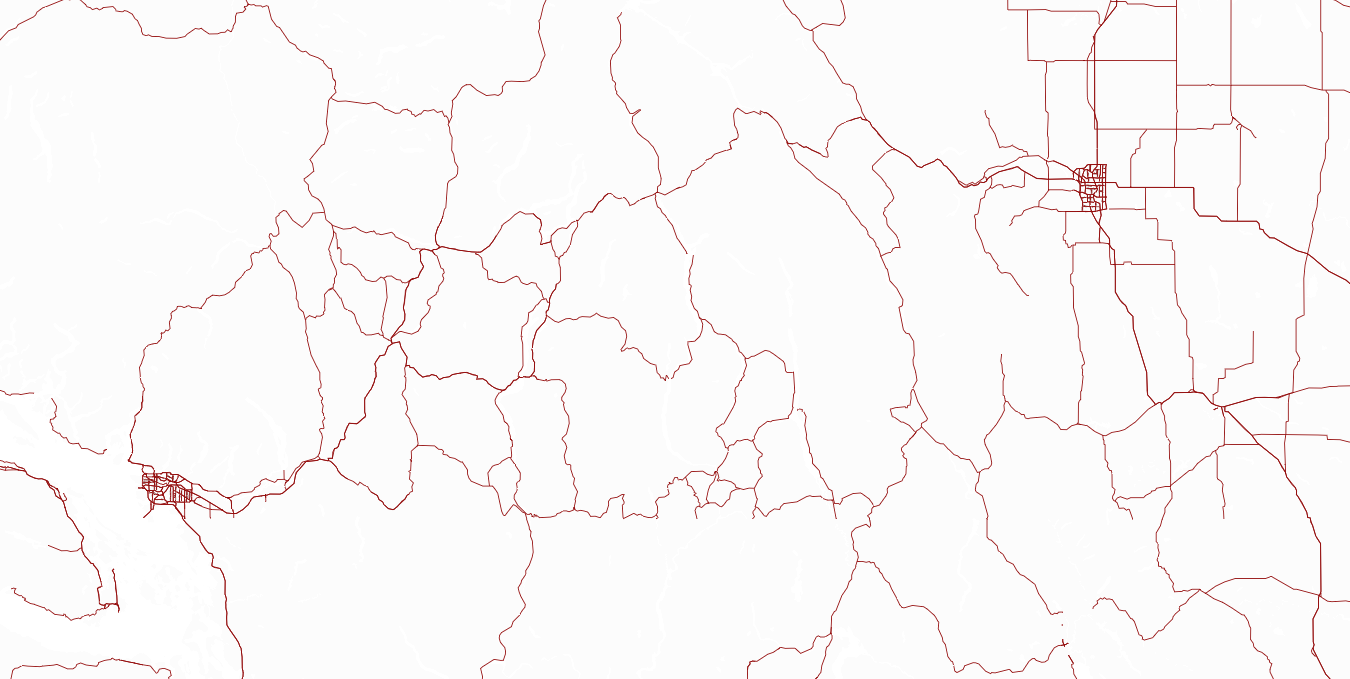
There are two cities on this map. It’s not very hard to spot them, is it? The cities are exceptionally dense networks of roads, compared to the relatively spare highways that connect them.
Interestingly, this same phenomenon occurs within cities:
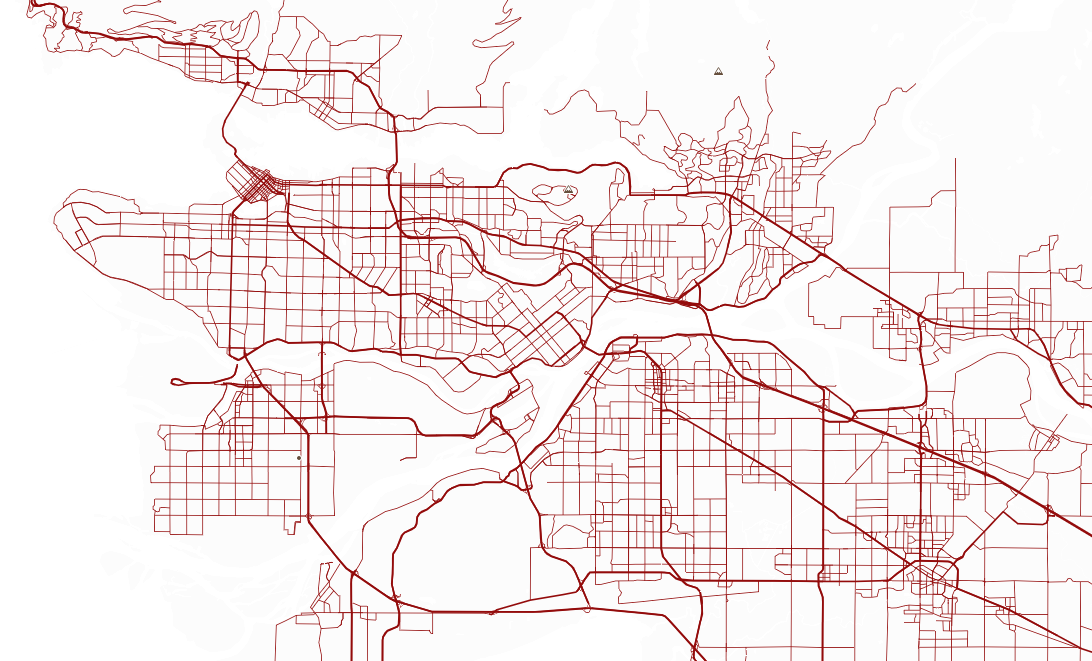
It’s easy to find downtown on this map, and if you pay attention to what are obviously bridges, you can find the smaller cities that make up the big metropolitan area. Again, the trick is to identify areas that have tightly woven intra-road networks, but relatively sparse interconnections.
We can use this same trick to identify “neighborhoods” of law — that is, clusters of cases that commonly cite one another, but which rarely cite other neighborhoods. Our algorithm starts by putting every case in its own (very lonely) community, and then merging communities which are more interconnected than should be expected by random.
After crunching the numbers, the five most important decisions in each of our three most important, highly-populated communities are:
Community 249
- Dunsmuir v. New Brunswick
- Canada (Citizenship and Immigration) v. Khosa
- Baker v. Canada (Minister of Citizenship and Immigration)
- Newfoundland and Labrador Nurses’ Union v. Newfoundland and Labrador (Treasury Board)
- Alberta (Information and Privacy Commissioner) v. Alberta Teachers’Association
In order to try and figure out what community this is (249 isn’t a great name4), I clicked on each CanLII link and read (with my eyes, like a peasant) the tags that whoever filed these cases wrote down. They are:
- Administrative law – Procedural fairness
- Administrative law – Review of discretion – Approach to review of discretionary decision making.
- Administrative law – Judicial review – Implied decision
- Administrative law – Judicial review – Standard of review
- Administrative law – Natural justice – Procedural fairness
- Administrative law – Role and adequacy of reasons – Procedural fairness
- Administrative law – Standard of review
- Courts – Appellate review
Looks like community 249 is really some sort of administrative review of law.
Remember, I only looked at these tags in order to try to give a human-appropriate name to community 249. The computer didn’t have access to these tags when it was discovering it; it was merely looking at where the roads are dense.
Community 527
- R. v. Oakes
- R. v. Big M Drug Mart Ltd.
- Re B.C. Motor Vehicle Act
- Andrews v. Law Society of British Columbia
- Irwin Toy Ltd. v. Quebec (Attorney General)
The tags here are:
- Constitutional law – Canadian Charter of Rights and Freedoms
- Constitutional law – Charter of Rights – Application
- Constitutional law – Charter of Rights – Freedom of expression
- Constitutional law – Charter of Rights – Fundamental justice
- Constitutional law – Charter of Rights – Presumption of innocence
- Constitutional law – Charter of Rights – Reasonable limits
Seems pretty cut and dried. “Charter of Rights.”
Community 192
With tags:
- Constitutional law – Canadian Charter of Rights and Freedoms – Unreasonable search and seizure
- Constitutional law – Charter of Rights – Admissibility of evidence
- Constitutional law – Charter of Rights – Arbitrary detention
- Constitutional law – Charter of Rights – Enforcement — Exclusion of evidence
- Constitutional law – Charter of Rights – Search and seizure
- Constitutional law – Charter of Rights – Security of person
- Constitutional law – Charter of Rights – Unreasonable search and seizure
- Criminal law – Interception of private communications – Access to sealed packet – Validity of wiretap authorizations
- Criminal law – Interception of private communications – Admissibility of evidence
- Criminal law – Power of search incidental to arrest
This one is very clearly on the police being naughty and doing things they shouldn’t.
I’ve said it before but I’m going to say it again. There is very clearly a theme in these cases, and we found it using only math, with absolutely no knowledge of the law.
Continuing Analysis of Communities
Just for fun, let’s chart decisions by year and community for the six most populated communities.
select name, year, importance, community from decisions where community in (19, 192, 225, 249, 527, 635) order by importance desc limit 500;
This gives us a sense of what sorts of things the law is focused on over time. For example, since 2010 there’s been a huge flurry of activity in community 249 (review of law.) Why? I don’t know, but clearly something is going on. The activity seems to be precipitated by Dunsmuir v. New Brunswick, so what we’re seeing is all the fallout from that case.
And we can see that community 192 (police being naughty) was very active from 1985 to 1995, but quieted down until a spike in 2009, and has been quiet since 2014. Maybe the police have been on good behavior since then?
Conclusion
I’ve now been writing for eight hours straight, and I can no longer reliably spell “jurisdiction.” So it’s time to finish this up and then go directly to bed.
Personally, I find it fascinating just how much information can be gleamed from nothing but citation data and some clever choices of visualizations. The biggest takeaways in terms of policy from this project in my opinion are:
- The amount of case law is growing super-linearly — and, horrifyingly, the curve appears to be exponential. Despite every court generating law at a constant rate, the growth rate of courts themselves is increasing. This is clearly an untenable system.
- Most decisions become irrelevant after only one year; the vast majority of hem are forgotten after ten.
- Somewhere between 33% and 50% of all decisions just follow precedent. That’s a waste of everyone’s time and the countries resources. There are huge efficiencies to be gained here if we can find a way of automating that stuff.
In aggregate, this means our legal system is doing a huge amount of work churning out an ever growing number of decisions which get added to the annals of time — a good chunk of which are completely trivial, and almost all of which are forgotten soon after. This is extremely good evidence that the court system structuring itself as an append-only datastructure is a bad design. There’s no reason to continuously write down the answer you already know, and never check it again; automate that stuff, don’t add it to the corpus of law, and save the courts for more important matters.
While we’re talking about automating things, someone could definitely use the community-finding algorithm to put the poor bastard responsible for adding keywords to case summaries out of his misery.
Some intriguing takeaways, with no relevance to anything:
- There appear to be many extremely important decisions (in terms of influence) that are not well-enough recognized to be on Wikipedia. Is this a flaw in Wikipedia’s coverage, or is the importance of these cases unknown to the world of law?
- This math stuff is actually useful for real-life things.
If you’re interested in running your own analysis on this data without needing to scrape CanLII for a few weeks, it’s available as a sqlite3 database. Hidden in the HTML of this page are all of the queries I ran to produce the graphs. Feel free to get in touch if you find anything interesting, I’d be happy to update this page with, or linking to, your discoveries.
Due to the differing dates of continuing coverage, we unfortunately can’t look at this metric over the history of Canadian law.↩︎
In a pre-print of this essay that contained only half of the dataset, 42 of the top 50 had Wikipedia articles. Of these cases, 31 were “leading” or “landmark.” It’s not clear to me why this metric degraded when adding more data, except possibly that the inclusion of more cases has brought out connections that are harder for humans to keep track of. I’m very confident in the math here.↩︎
I’d like to have checked a few thousand, but this is a very manual process.↩︎
“There are only two hard things in Computer Science: cache invalidation and naming things.” –Phil Karlton↩︎